

How To Measure Data Quality
Getting Started
How to quantify Data Quality?
From individual data quality metrics to a unified score.
![]()
In this article, I will to explain the concepts behind computing a unified data quality score as it is used in IBM Cloud Pak for Data and IBM Information Server / Information Analyzer to quantify the quality of structured data.

The need for a simple data quality score
Measuring data quality is not a new field. IBM Information A n alyzer and other data profiling tools have been on the market for more than one decade to help data engineers better understand what they have in their data and what they may have to fix.
In the early days of data profiling, despite the rich set of features that such tools could provide to look at the quality of a data set, it was not really easy to answer these simple questions:
How good is the overall quality of this data set?
Which of these two data sets has the better data quality?
How does the data quality of this data set compares to what it was last month?
Even when using a single data profiling tool like IBM Information Analyzer as it was in its early days, you could assess the quality of data sets by looking at the data from very different angles by using different features:
- You could use the statistics collected by the data profiler, to determine which values or formats detected in the data set should be considered as valid or invalid in each column.
- You could define the domain validity of each column as a minimum/maximum range of valid values, or by pointing it to a list of reference values.
- You could detect or assign data classes for each column and search for values that do not match the expected data class.
- You could look at missing values.
- You could identify primary key candidates and search for unexpected duplicated values.
- You could identify primary-foreign key (PK-FK) relationships between tables and search for orphan values in foreign key columns, which are not found on the primary key of the relationship.
- You could define data rules to set any non trivial additional expectation on the data.
This list only covers what the data profiling and quality features of Information Analyzer could tell you on the data. Other components of the IBM Information Server suite, such as QualityStage could give you other data quality information like duplicated rows, or values lacking a proper standardization, etc…
Although each of these features were powerful by themselves and could provide interesting individual metrics for the expert, their results were not suitable to answer the simple questions listed in the introduction of this article. The primary reason for that is that humans are not good at comparing multi-dimensional metrics with each others, especially if those results do not include the exact same metrics or are computed from different data sets having a different number of rows, columns or have different constraints/rules that they should match.
As data catalogs became important because of the emergence of data lakes, data science, data governance and all these new kind of activities around data, data quality became something not only important for the expert user but needed to become understandable for non-experts.
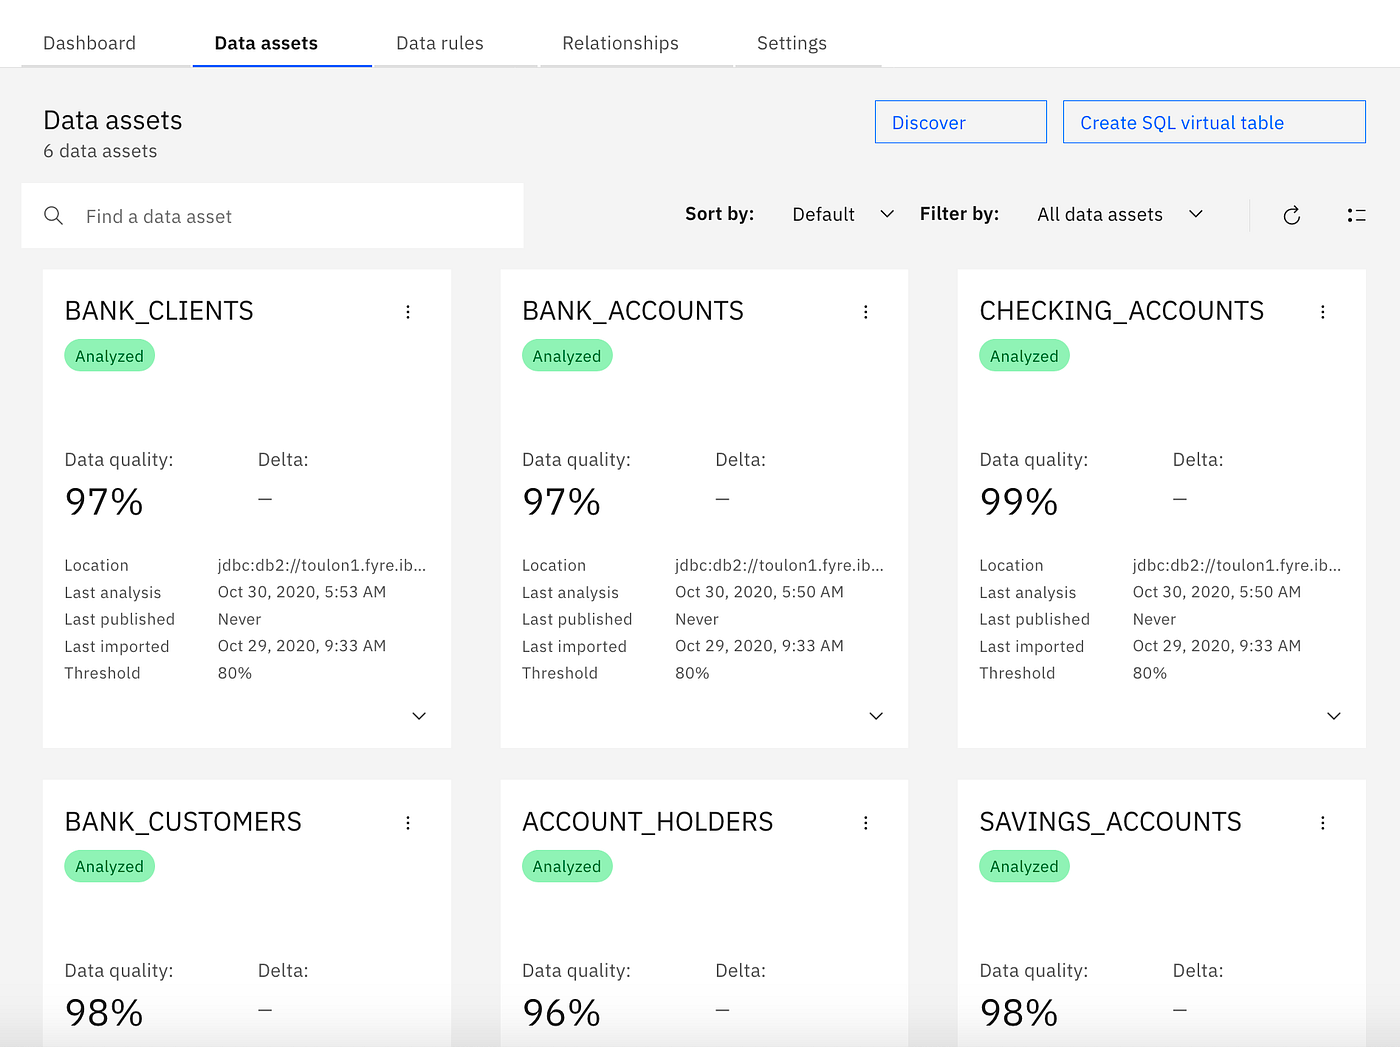
In this previous article, I have shown how large number of data sets can be automatically ingested, analyzed, catalogued, governed and made available for consumers like data scientists or data analysists. Those users need to find the right data set with the right quality in a self-service mode. For this scenario, it becomes obvious that there is a need for a simpler metric to get a good idea of the level of quality of a data set, without having to look at the details, even if those details are still available for the second look.
This is the reason why the notion of data quality was introduced in IBM Information Server and now in IBM Cloud Pak for Data / Watson Knowledge Catalog.
But how to design a good data quality score?
Given the fact that data quality can be seen from very different angles and measured by very different metrics, such as the few ones I listed previously, the formula for computing a quality score is not necessary obvious. In order to better understand how it is computed in the IBM offering, let us have a first look at the requirements that we have against such a score:
- The data quality score should be simple to understand: It should be possible, when looking in the catalog at a large number of data sets, to quickly identify high or low quality data sets, without having to look at the details.
- The data quality score should not depend on the number of rows, columns or constraints set on the data set: For instance, the data quality score of a large data set should be more or less the same if computed by analyzing all rows of the data set as if computed on a smaller sample — assuming that the sampling is good enough to be statistically representative.
- The data quality score should be comparable with other data quality scores, even if the metrics used for each score are different and/or the compared data sets have different number of rows and columns — see previous the requirement.
- The data quality score should be normalized: It should provide a clear range of what is the lowest and highest possible score so that a user can see how far away the data quality of a data set is from what should be considered as ideal.
In order to define a formula which can transform the different metrics that are computed by the various data quality functions into a score matching these requirements, we need first to formalize what we understand behind the notion of data quality in general and data quality score in particular.
There are many definitions of data quality. You can see on Wikipedia for a few of them. But a simple definition could be:
Measuring the data quality of a data set is measuring how good the data set matches the expectations that you have on the data.
This means that the data quality score can only depend on the expectations that you have on the data and not on some raw number of findings.
That may sound obvious, but that means that if we find in a column a large number of missing values, but we do expect missing values in this column, or we don't care about missing values there, then the data quality score of the data set should not be degraded because of the found missing values.
This also means that if we have no concrete expectation on the data, then the data quality score should be maximum, no matter what is in the data.
These simple obvious facts are important to setup the architecture of the score.
The notion of constraints and data quality issues
Let us define a few concepts playing an important role in the computation of a data quality score:
The expectations that we have on the data is what we will call constraints. A constraint can be expressed in very different forms:
- It can be a simple flag set on a column to indicate that the values in this column should not be null, or should be distinct, or should not be signed.
- It can be a definition of the domain validity of a column, set as an eventual minimum or maximum allowed value, or a pointer to a list of reference values defining the acceptable domain of a column
- It can be a data class assigned to a column which not only describes the content of the column but also can be used to identify values which do not comply with the expected domain of the column.
- It can be an identified relationship between two data sets, setting a correlation or functional dependencies between multiple columns.
- It can be a data rule expressing a non trivial type of constraint that may even involve multiple tables.
We have a data quality issue wherever the data do not fulfil one of the constraints.
A data quality issue is the report of a specific data quality problem type on either a single cell, or a single row, or a single column or a group of columns of a data set, or on the data set as a whole. The data quality problem type reported by the data quality issue depends on the type of constraint which are not fulfilled by the data.
A data quality issue can be detected with a certain frequency on a column or on the data set. The relative frequency, computed as percentage of all values of a column/data set which have the quality issue is what we call the prevalence of the problem.
For instance, if a data set has 100 rows, and 15 missing values are detected in a column marked as mandatory or not nullable, then a data quality issue of problem type "missing value" is reported on this column with a prevalence of 15%.
Implicit or explicit constraint and the notion of Confidence of a data quality issue
In addition to the prevalence, a data quality issue may be associated with a confidence. The confidence represents the probability that the reported issue is a real problem.
To better understand this notion, you need to understand that not all constraints set on the data are clear constraints specified or confirmed by a human — we will call such a specified or confirmed constraint an explicit constraint.
If the data quality would be only measured based on explicit constraints, then we wouldn't need the notion of confidence, because all constraint specified by a human and not respected by some data would result in a data quality issue of confidence 100% — we know for sure that the problem is a real problem, because somebody has specified that anything not fulfilling this constraint should be considered as a data quality issue.
But if we would only look at explicit constraints, then all data sets would start with a score of 100% until somebody takes the time to look at it and specify constraints. This would result in either having a large number of data sets with a false appearance of high quality, or in a process requiring each ingested data set to be carefully reviewed by a steward, which would not scale well for large imports.
For this reason, during the data quality analysis, the system may try to guess some constraints, based on what is seen in the data. If for instance a large majority of the data of a column are not null, or they use the same format or have any kind of recognizable pattern — even if some values do not follow these patterns — , then the system may assume that there is an implicit constraint and that the values which do not fulfil it may be data quality issues.
Since an implicit constraint is inferred by the system from what is seen in the data, it is associated with a notion of confidence, determining how sure the system is that this should be a real constraint.
If for instance 95% of the values of a column are 5 digits number, but 5% have a completely different format, the system may — depending on the settings — assume that there is an implicit constraint on this column that the values should have 5 digits, with a confidence of 95%. If the user reviews this implicit constraint and confirms it, then it would become an explicit constraint with a confidence of 100%.
Both the prevalence and the confidence of detected quality issue will be used in the computation of a realistic quality score.
Putting it together into a unified quality score
Now that we have introduced all the important notions playing a role in the data quality score, let us see in a simple example how the score is computed in IBM Cloud Pak for Data or Information Analyzer:
Let's assume a simple data set with 3 columns and 6 rows and the following identified data quality issues:
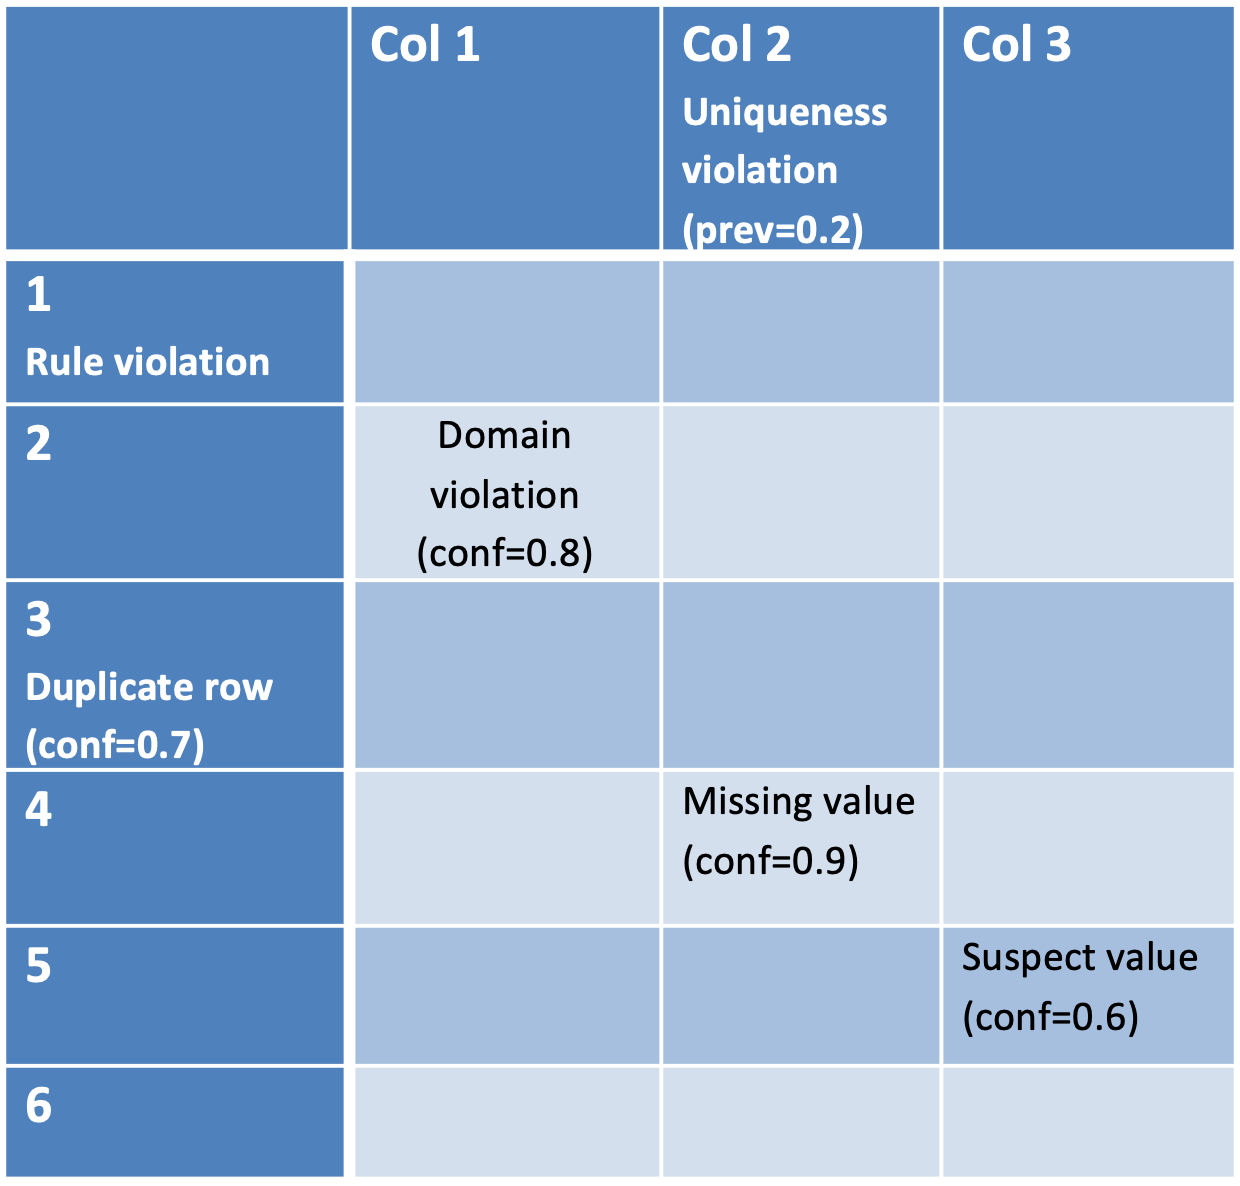
- Row #1 violates a data rule. Since a data rule is specified by a user, it is an explicit constraint and the confidence of the issue is 100%.
- Row #3 is a duplicate row, but there is no explicit constraint indicating that duplicated rows should not be allowed. However based on the data, the analysis determined that there is 70% probability that this data set should not expect duplicated row. => there is an implicit constraint on the data set indicating with 70% confidence that there should not be any duplicated record.
- The cell of row #2 and column Col1 does not fulfil an implicit constraint with a confidence of 80% defining what a valid domain should be. This may be the case for instance if the analysis determined an inferred data class for this column with a confidence of 80% and if the value in that cell doesn't match the data class.
- Column Col 2 has been set an explicit constraint indicating that all values should be distinct in this column, but the analysis found 20% duplicate values in it. This results into a data quality issue with a confidence of 100% and a prevalence of 20%.
- Additionally to that, the value of Col 2 in Row #4 is missing and there is an implicit constraint of confidence 90% that missing values should not be expected in this column.
- Finally the cell at Row #5 / Col 3 seems to be an outlier for this column with a confidence of 60%. Outliers are always implicit constraints, since there is no hard rule defining when a value is an outlier or not.
Data Quality Score of a single cell
Note that a single cell, column or row may have more than one data quality issue and that, if possible, the problem should not be double counted: if a single value violates both its expected data class and its expected format, it should not double penalise the data quality score of the column or data set, because only one value is invalid, no matter how many issues this value has.
Based on that, the score of a single cell of a data set can be computed as the probability that the value has no issue at all. This can be computed as the product of 100% minus the confidence of each problem detected on the cell. To illustrate this: if we are for instance 90% confident that an issue exists on a cell, then the probability that the values doesn't have the issue is 100–90=10%. If the confidence of the issue is 100% — for an explicit constraint — then the probability that the value has no issue is 100–100=0%
For data quality issues which are reported on the individual cells of a data set, the formula to compute the score of the cell is as follow.
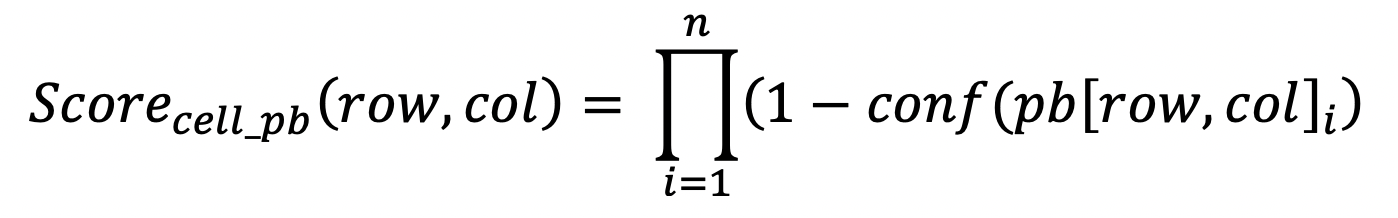
If a cell has 2 issues, one of confidence 80% and the other of confidence 60%, then the probability that the first issue is not real is 100%-80%=20%, the probability that the second issue is not real is 100%-60%=40%, and the probability that none of the issue is real and the cell has no data quality issue is only 20% multiplied by 40% = 8% according to the laws of probability.
Now remember that I mentioned at the beginning of this article that data quality issues can also be reported for a complete row, or a complete column or a complete data set. We need to distribute the effect of these issue on the score of the cells.
For a problem reported for a complete row, this is easy because if the row is invalid, we can assume that all values of the row are invalid. The effect of such issues on the score of the cells can be computed as follow:
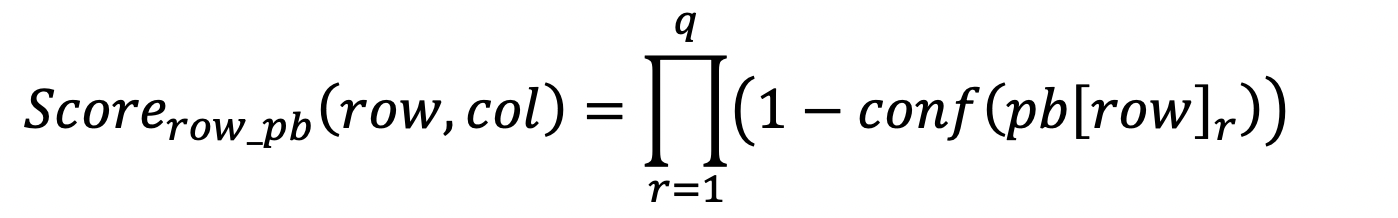
conf(pb[row]) represents here the confidence of one row level data quality issue reported for the row of the cell being measure.
However problems reported for complete columns need to be equally distributed among all values of the column by using the prevalence of the problem. The prevalence tells us that n% of the values are affected by the issue, although we don't know exactly which values have the issue and which don't. For this reason, each value will have its score degraded by a factor equal to the prevalence multiplied by the confidence that the issue is real, as shown by the following formula:
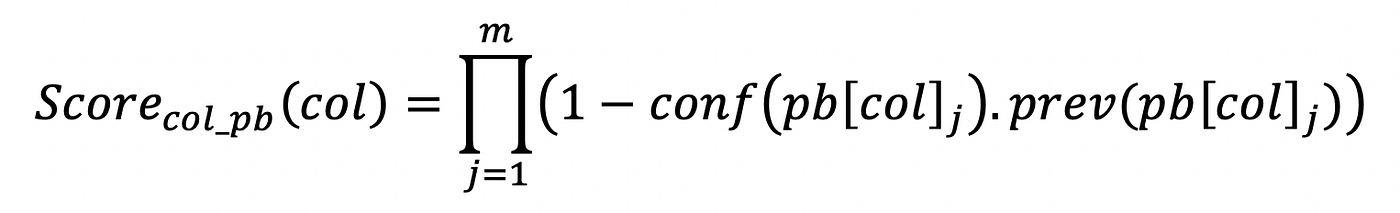
conf(pb[col]) represents the confidence of one column level data quality issue reported for the column of the cell being measured, and prev(pb[col]) represents its prevalence — the percentage of values in the column having that issue.
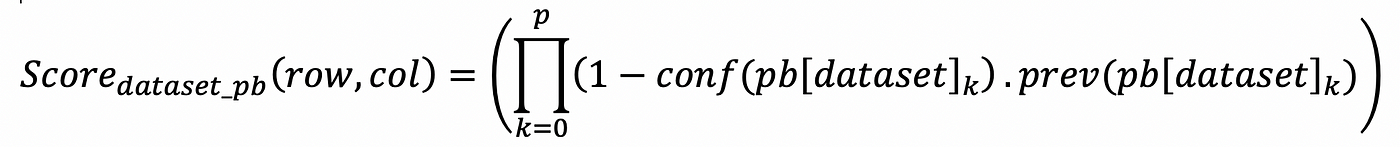
The effect of the data quality issues reported for the data set as a whole are distributed the same way among all cells:
The final data quality score for an individual cell, considering all issues reported on the cell itself, on its column, on its row or on the data set can be computed as:
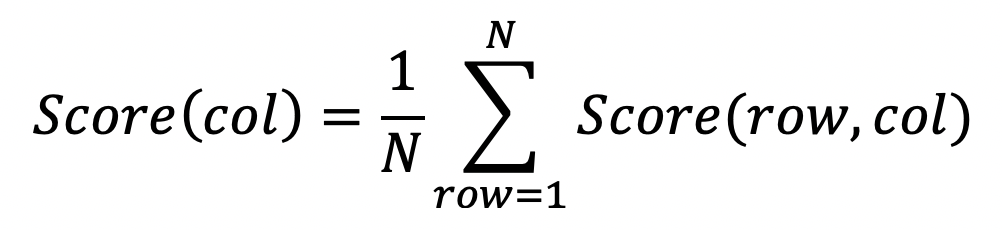
Data Quality Score of a column
The previous formulas have set the foundation for computing a data quality score normalized between 0% and 100% for each individual cell of a data set. Based on this, computing the data quality score of any column becomes as simple as computing an average of the data quality scores of each value of the column.
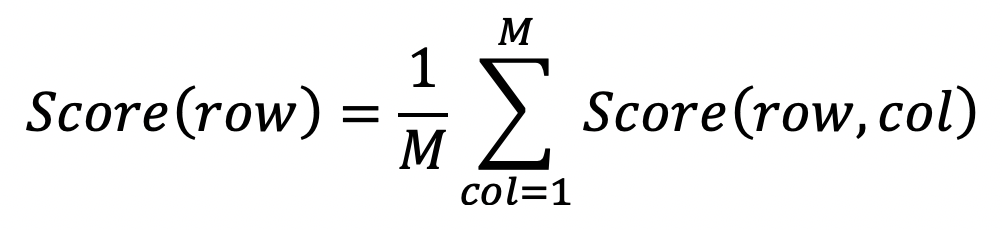
Data Quality Score of a row
The same way, a score can be computed for any row of the data set by averaging the scores computed for each cell of the row.
Data Quality Score of the data set
Computing the data quality score of the data set is then as easy as computing either the average of the scores for each column, or the average of the scores for each row.
Note that it is also the same as computing the average of the scores of all cells. All these computations will return the same result because of the symetrical aspect of the formula, which makes it elegant.
Example:
Let's apply those formulas on our previous concrete example:
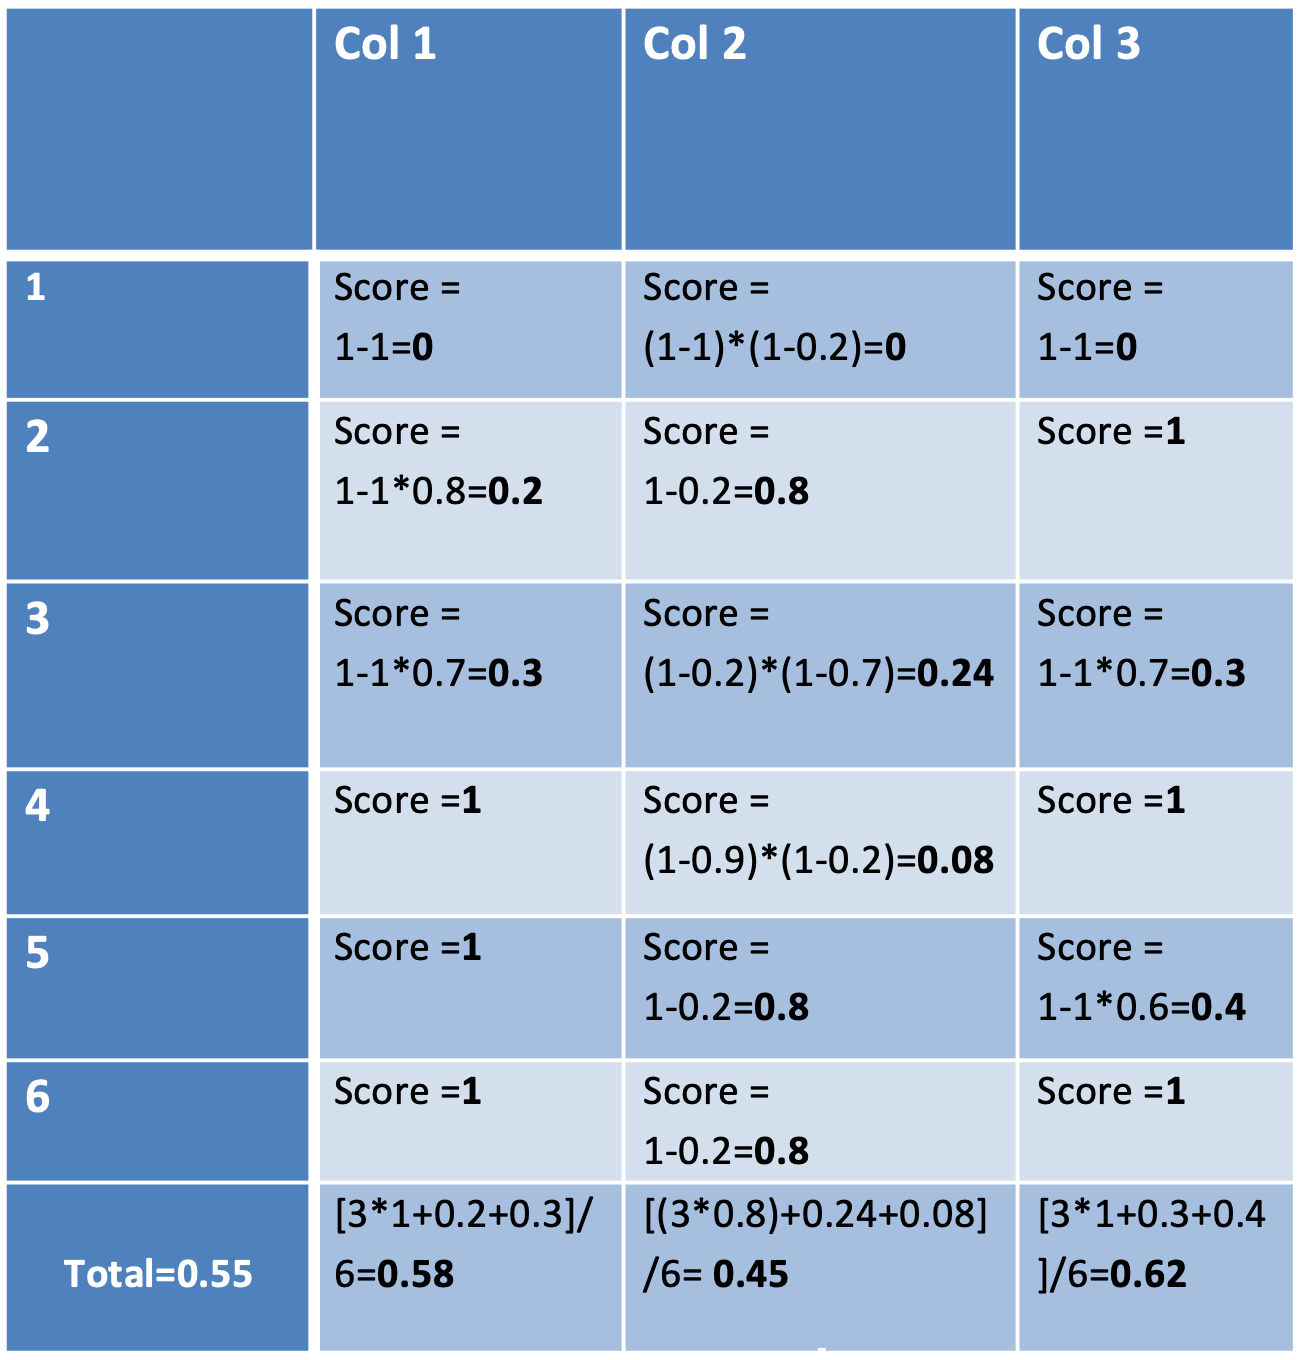
Using the previous formula, you can compute a quality score for each cell, as well as for each column, or each row, and averaging either the cell scores, or the column scores or the row scores you return the same result (55%) representing the data quality score of the data set.
A report could then drill down in any column or row and show more details about their data quality scores, which row or column degrade the data set score the most, etc… This ability to drill down is useful for data cleansing operations.
Summary
We have seen why it is important to have a unified standardized data quality score for each data set, so that it can be used by non data quality expert. We have seen what requirements such a data quality score should fulfil to be useful even in non trivial cases where data sets with different structures or constraints need to be compared with each others. We have finally seen how this data quality score is implemented in the IBM portfolio.
How To Measure Data Quality
Source: https://towardsdatascience.com/how-to-quantify-data-quality-743721bdba03
Posted by: rodriguezquakfank.blogspot.com
0 Response to "How To Measure Data Quality"
Post a Comment